of a head-to-head battle between a bull (the buyer)
and a bear (the seller). Bulls push prices higher, and
bears lower them. The direction prices actually move
shows who wins the battle
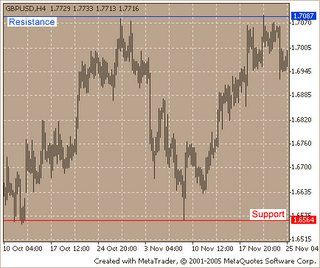
Support is a level at which bulls (i.e., buyers) take control
over the prices and prevent them from falling lower.
Resistance, on the other hand, is the point at which sellers
(bears) take control of prices and prevent them from rising
higher. The price at which a trade takes place is the
price at which a bull and bear agree to do business.
It represents the consensus of their expectations. Support
levels indicate the price where the most of investors
believe that prices will move higher. Resistance levels
indicate the price at which the most of investors feel prices
will move lower. But investor expectations change with
the time, and they often do so abruptly. The development
of support and resistance levels is probably the most
noticeable and reoccurring event on price charts.
The breaking through support/resistance levels can be
triggered by fundamental changes that are above or
below investor's expectations (e.g., changes in earnings,
management,competition, etc.) or by self-fulfilling prophecy
(investors buy as they see prices rise). The cause is not
so significant as the effect: new expectations lead to
new price levels. There are support/resistance levels,
which are more emotional.
Supply and demand
There is nothing mysterious about support and resistance:
it is classic supply and demand. Remembering supply/demand
lines show what the supply and demand will be at a given price.
The supply line shows the quantity (i.e., the number of shares)
that sellers are willing to supply at a given price. When prices
increase, the quantity of sellers also increases as more investors
are willing to sell at these higher prices. The demand line shows
the number of shares that buyers are willing to buy at a given
price.
When prices increase, the quantity of buyers decreases as
fewer investors are willing to buy at higher prices. At any
given price, a supply/demand chart shows how many buyers
and sellers there are. In a free market, these lines are
continually changing. Investor's expectations change, and
so do the prices buyers and sellers feel are acceptable.
A breakout above a resistance level is evidence of an
upward shift in the demand line as more buyers become
willing to buy at higher prices. Similarly, the failure of a
support level shows that the supply line has shifted
downward. The foundation of most technical analysis
tools is rooted in the concept of supply and demand.
Charts of prices for financial instruments give us a superb
view of these forces in action.
Traders’ remorse
After a support/resistance level has been broken through,
it is common for traders to ask temselves about to what
extent new prices represent the facts. For example, after
a breakout above a resistance level, buyers and sellers may
both question the validity of the new price and may decide
to sell. This creates a phenomenon that is referred to as
"traders’ remorse": prices return to a support/resistance
level following a price breakout.
The price action following this remorseful period is crucial.
One of two things can happen: either the consensus of
expectations will be that the new price is not warranted,
in which case prices will move back to their previous level;
or investors will accept the new price, in which case prices
will continue to move in the direction of the breaking through.
In case number one, following traders’ remorse, the consensus of
expectations is that a new higher price is not warranted,
a classic "bull trap" (or false breakout) is created.
For example, the prices broke through a certain resistance
level (luring in a herd of bulls who expected prices to move
higher), and then prices dropped back to below the resistance
level leaving the bulls holding overpriced stock. Similar
sentiment creates a bear trap. Prices drop below a support
level long enough to get the bears to sell (or sell short) and
then bounce back above the support level leaving the bears
out of the market. The other thing that can happen following
traders’ remorse is that investors expectations may change
causing the new price to be accepted. In this case, prices will
continue to move in the direction of the penetration. A good
way to quantify expectations following a breakout is with the
volume associated with the price breakout.
If prices break through the support/resistance level with a
large increase in volume and the traders’ remorse period is
on relatively low volume, it implies that the new expectations
will rule (a minority of investors are remorseful). Conversely,
if the breakout is on moderate volume and the "remorseful"
period is on increased volume, it implies that very few investor
expectations have changed and a return to the original
expectations (i.e., original prices) is warranted.
Resistance becomes support
When a resistance level is successfully broken through,
that level becomes a support level. Similarly, when a
support level is successfully broken through, that level
becomes a resistance level. The reason for it is that a
new "generation" of bulls appears, who refused to buy
when prices were low. Now they are anxious to buy at
any time the prices return to the previous level. Similarly,
when prices drop below a support level, that level often
becomes a resistance level that prices have a difficult
time breaking through. When prices approach the
previous support level, investors seek to limit their
losses by selling.
Happy learning
 earn money online-|-
forex auto trading-|-
forex trade-|-
forex trading-|-
forex trade-|-
forex trade-|-
lawyer-|-acne-|-sinus-|-|-cancer treatment-|-
earn money online-|-
forex auto trading-|-
forex trade-|-
forex trading-|-
forex trade-|-
forex trade-|-
lawyer-|-acne-|-sinus-|-|-cancer treatment-|-
No comments:
Post a Comment